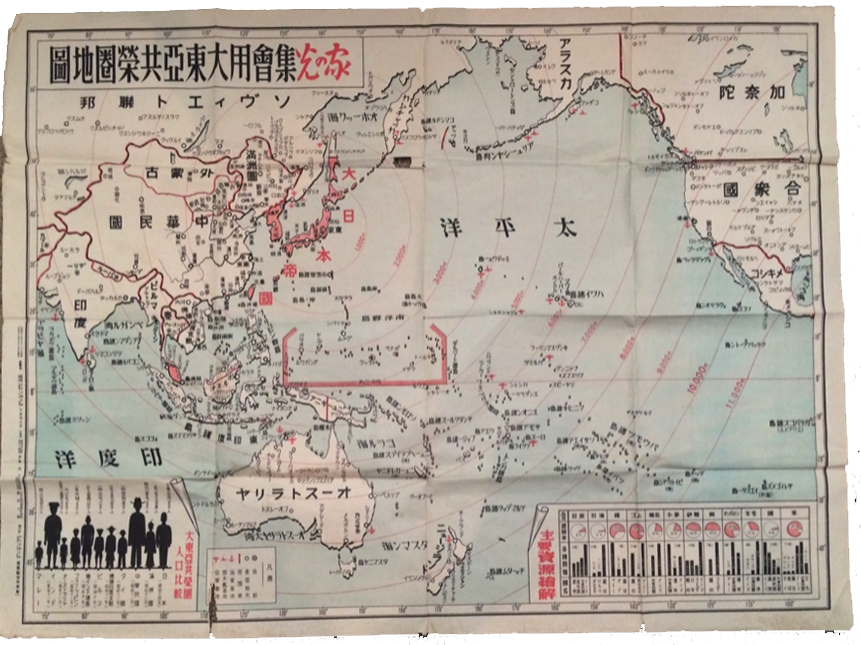
1942 MAP OF THE ASSEMBLED GREATER EAST ASIA CO-PROSPERITY SPHERE FOR MEETING USE
REPRODUCTIONS ONLY
The map was printed June 20, SHOWA 17 (1942) and released on June 25th of the same year. This map was originally for government use only and was not for sale to the public.
During WWII, mandatory community meetings across Japan were requested by the Government to educate the public about the benefits of the Greater East Aisia Co-Prosperity Sphere, consequentlylarge wall maps were printed for this purpose but few survived in decent condition due to their frequency of use, exposure to the elements or destroyed as evidence.
This rare map’s purpose was strictly for government use and no copies were made available for sale to the public. This is a prime example of the implementation of the Greater East Aisia Co-prosperity Sphere as an instrument of propaganda. At these meetings people were shown all of the members who made up the sphere and the resources they provided for the ultimate benefit of Japan. The map measures approximately 31 x 41 and has been expertly linen backed.
The Greater East Asia Co-Prosperity Sphere (大東亞共榮圏 Dai-tō-a Kyōeiken) was an imperial propaganda concept created and promulgated for occupied Asian populations during the first third of the Shōwa era by the government and military of the Empire of Japan. It extended greater than East Asia and promoted the cultural and economic unity of Northeast Asians, Southeast Asians, and Oceanians. It also declared the intention to create a self-sufficient "bloc of Asian nations led by the Japanese and free of Western powers". It was announced in a radio address entitled "The International Situation and Japan's Position" by Foreign MinisterHachirō Arita on June 29, 1940.
The information in the insets have been expertly translated as follows:
(at lower left) Greater East Asia Co-prosperity Sphere –Comparison of the Populations (figures from right to left)
1) Japan -105,226,000 people (as of 1939)
2) Manchukuo – 36,672,705 people (as of 1937)
3) China (including Taiwan) – 427,507,000 people ( as of 1936)
4) Thailand – 14,464,500 people (as of 1937)
5) French Indo-China – 23,030,300 people (as of 1937)
6) Burma – 14,667,100 people (as of 1931)
7) East Indian Archipelago – 60,954,890 people (as of 1934)
8) Philippines – 15,984,000 people (as of 1938)
9) Australia – 6,807,000 people (as of 1936)
10) India – 358,550,000 people (as of 1936)
11) Malay – 4,895,496 people (no date given)
(at lower right) Illustration of Important Resources
KEY: Name of Product
Percentage of Total Amount (does not state % worldwide or % in co-prosperity sphere)
Name of Country
Each Country’s Separate Amount
FROM LEFT TO RIGHT
12. RICE 90% (In thousands of kilograms)
Japan 15,627
China (including Taiwan) 48,040
India 42,288
Dutch East Indies 5,676
French Indo-China 5,290
Thailand 4,716
11. IRON 4% (In thousands of kilograms)
China (including Taiwan) 323
Manchukuo 647
Australia 970
India 1,576
10. WOOL 31% (In kilograms)
Australia 458,100
China (including Taiwan)
India 4,500
9. TUNGSTEN 80% (In kilograms)
Australia 4,188
China (including Taiwan) 6,305
Malay 791
8. FLAX/HEMP 48% (In kilograms)
Philippines 178,500
Dutch East Indies 80,000
7. REFINED SUGAR 45% (In thousands of kilograms)
India 3,600
Philippines 1,000
Japan 1,560
Dutch East Indies 1,550
6. WHEAT 20% (In thousands of kilograms)
India 10,967
Australia 4,109
China (including Taiwan) 17,321
5. RAW COTTON 20% (In thousands of kilograms)
India 1,048
China (including Taiwan) 635
4. RUBBER 90% (In thousands of kilograms)
Malay 424
Borneo(?) (information is smudged)
Dutch East Indies 288
3. COPPER66% (In kilograms)
Dutch East Indies 39,800
Thailand 16,200
Malay 79,300
2. CRUDE OIL 3% (In thousands of kilograms)
Dutch East Indies 7,262
Burma 1,103
Borneo789
1. COAL 8% (In thousands of kilograms)
India 25,624
China (including Taiwan) 15,000
Manchukuo 12,000
Australia 11,500


